Monthly Archives: April 2025

Timelines: Tips for Analysis

There are some things you will want to consider when setting up a timeline for your ancestor or project.

First, how are you going to make it (special software, spreadsheet, word processor, paper and pencil)? What tools you use to create your timeline might dictate some of the next items. I like to use digital means, usually a spreadsheet or a word processor, because they are easy to add to, rearrange, sort automatically, etc. However, as a pre-computer native, I like paper and pencil. If I were going to create a timeline for a project on paper, I would suggest using notecards or sticky notes, one for each event, that you can add to and rearrange as needed.

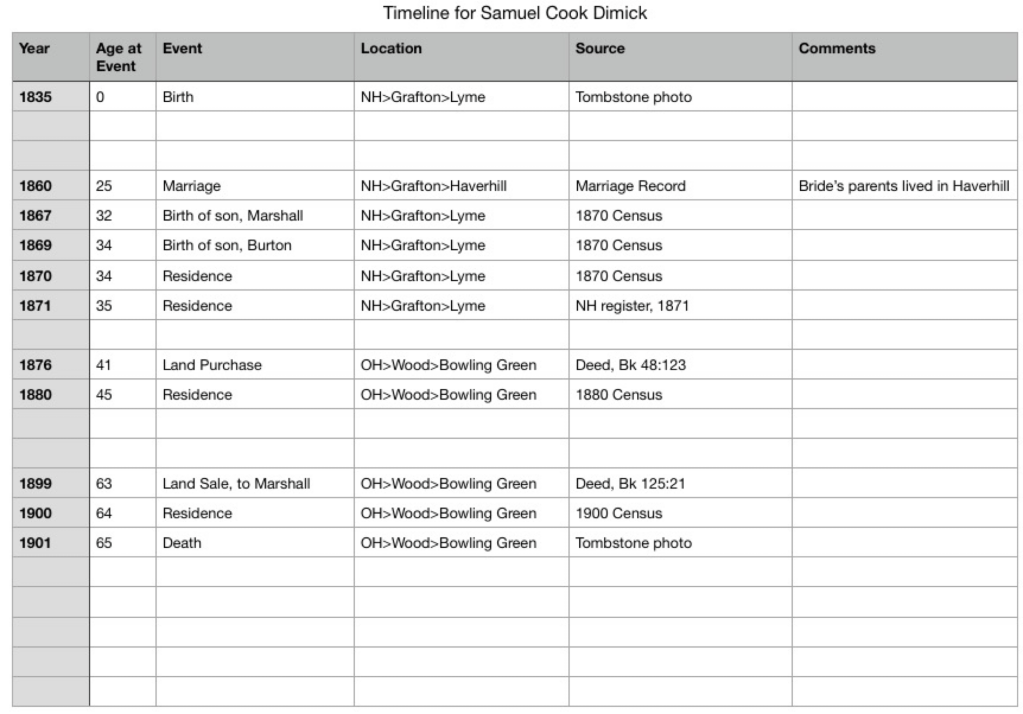
Second, what kind of information do you want to capture. You’ll need to decide on a format so your timeline is consistent. When I am using a spreadsheet, I will tailor the columns to fit my needs for that particular project. For a general timeline for an ancestor’s life, I use these column headings:

  • Year – I usually only use the year unless I need to get more granular, then I’ll change this to a numerical sortable date system such as Year/Month/Day. You may have to work with your spreadsheet’s formatting for numbers so it appears correctly. I usually set them to “text” rather than it trying to interpret a date.
  • Age at the time of the event – I like to capture this because it often tells me something about the person or the event. If someone is paying taxes or getting married, but their age is too young or too old, then it might indicate that I’ve made a mistake somewhere.
  • Name of the event – I keep it simple when possible so “Birth” or “Marriage” usually suffices.
  • Location – Depending on what you are looking for, you might put in the place from largest to smallest or smallest to largest. For example: Lyme, Grafton, New Hampshire vs. New Hampshire, Grafton, Lyme. If I want to see all of the New Hampshire items together, I might opt for the large-to-small option.
  • Citation/source – this does not have to be a full-on polished Evidence Explained citation, but don’t skip this step. I am always second-guessing myself. I do not know how many times I’ve had to recreate my research because I forgot to note where I got a piece of information. Timelines are no different. When you find something that conflicts, you’re going to want to know where you got that information. Do something that works for you, if that’s a link to a document or database, a full citation, or simply “Samuel’s death certificate.” As long as your note tells you enough to go re-examine the record, you’re good.
  • Misc. Notes – When I am creating these timelines, questions invariably come up, or I might want to make a note about a particular event. Put in a misc. notes column to capture those ideas and thoughts.
A work-in-progress timeline for Samuel Cook Dimick.

Next we will look at some more specialized timeline set ups for various projects.

Timelines: Why?

As genealogists, we gather a lot of data. We find our ancestors in many records such as obituaries, death and birth certificates, deeds, wills, church records, tax records, military records, and so on. The list is endless. How do you analyze, process, or understand the information you’ve gathered? And if you’re working on a trickier project, say figuring out which of the 12 George Longs is your ancestor, how do you keep it all straight?

One of my absolute favorite strategies is timelines. Creating a timeline for your ancestor puts his or her life into context and perspective. Obviously (or maybe not), a timeline is a list of events in chronological order. They show the “lifespan” of an individual, a place, or an historical event. Depending on what your goals are, you can create timelines with different focuses. The two main focuses I use are event-focused or document/source-focused.

Each document was created on a date (sometimes you know that date because it is written on the document, sometimes you might have to make an educated guess based on context). By putting together a document-focused timeline you can assess your research and make a plan for any research holes you find.

Document-focused timeline

Documents or sources may list multiple events. A death certificate, for example, will list a date of death, but also may list the birth date, the burial date, the onset of an illness, the date of a coroner’s inquest, etc. An event-focused timeline pulls all those dates out.

Event-focused timeline

As you enter your data into your genealogical software or online tree, if you use them, they may automatically put the events in chronological order, helping you to visualize your ancestor’s life. When I get deep into a project, however, I tend to work in a spreadsheet or word processor so I can reorder things, put in items that may I may not want in my software, add historical context items, and link citations.

Next, we will look at using timelines to compare and analyze your research.

Analysis and Correlation Tools used in George Long Project: Timeline

I love timelines. They have so many benefits when it comes to genealogical research. It helps you see an ancestor’s life in order. We get so many records, bits of information, and other clues, that putting them in time order helps me to see their life. It also helps to solve some genealogical problems such as if you’re working with one man or more of the same name, like my 12 George Longs.

The main thing I use them for is to help me find holes in my research. When I find gaps in time especially if they also changed location, I start asking questions, the main one being “what records can I find that will help fill in this gap?”

For George Long, I had twelve candidates. Many of them I could easily eliminate, usually because they didn’t end up in Hancock County, Ohio. Some of them died too early, or married women not named Isabella. But when I narrowed in on the “correct” George Long, I found him in a couple of locations before he made it to Hancock County. I had to be sure his time in those locations made sense. A timeline did this for me.

I’m just showing you part of the timeline, and I’m not showing the footnotes, but rest assured, there are citations for each fact. I needed to show that the George Long in Cross Creek Township of Jefferson County, stopped showing up in the tax lists just as the George Long of White Eyes Township in Coshocton County buys land and starts paying tax in that county. Later, I show the sale of his Coshocton County land (an him no longer on tax lists) just before his purchase of land in Hancock County.

The timeline helped me demonstrate that this was indeed one man and his life events lined up with those of the Hancock County George.

Of course, other records were used, there is a DNA portion to my case, and I had a series of conflicts I needed to resolve, but these last several blog posts have hit the highlights of my George Long project. I hope it gave you a bit of insight into my recertification process.

Analysis and Correlation Tools used in George Long Project: Mind Map

To keep track of the data, and to be able to visualize the information I was dealing with, I successfully used a mind map on this project. I shared a very zoomed out view in a previous post. I identified 12 George Long candidates! I had to figure out some way to keep track of them, determine which George Long a particular record belonged to, and compare information so I could eliminate the wrong men.

I have not used mind maps much in my previous work. They just didn’t seem to apply to projects I was working on as well as another tool did. When I am writing, I usually start with an old school outline. That’s just how I was trained in my early english writing classes, and it stuck with me and makes the most sense to me. However, it was not working when it came to dealing with all of the George Longs. I had many documents and needed to be able to distill them down to individuals. A mind map worked great for this.

Here is a zoomed in section of my mind map for candidates numbered 1 and 2.

As I collected data from documents, and as I could determine who they belonged to, I added them as a “bubble” to my mind map. The colors didn’t mean a lot except to depict a different type of record, and I wasn’t necessarily consistent. The red bubbles were the starting point information and any records I could tell belonged to the same man.

Keep in mind, the mind map evolves over time. You’ll notice that there is a note in the image above about the 1840 census for a George Long in Columbiana County, that the correct man was found in Coshocton in 1840. That note came later, of course.

As I was working, I would suspect that two men I had were actually the same man, so I would make notes to that effect, such as the question in this image. “Is Candidate #8 the same man as Coshocton George?”

Then I would do more research to answer that question.

I would go around and around with questions and research until I felt like I had a solid understanding of who each man was and why they are not the “correct” George Long.

Again, keep in mind you are seeing the last version of this before I started writing. This was used as the outline to write up my final findings on the George Long project. The mind map, in my use of it, is never meant to be a final product. I would not publish a mind map as a visualization of my research. It is just for my own organization and visualization of the information gathered.

Next time we will look at the timeline I created for this project. It was the other major tool I used to prove which George Long was the correct George Long. Until then…