Category Archives: Strategies

Timeline Analysis

I mentioned my timeline for my ancestor Samuel Cook Dimick a few blog posts ago. Let’s take a look at his story. When I was first researching him, one of my main questions was “why.” Why did he take his family away from New Hampshire (where it is beautiful, I’ve visited) to Wood County, Ohio? Wood County is about as flat as flat can be (well, with the exception of large parts of Kansas and eastern Colorado, but I digress). Why was I from Ohio and not New Hampshire?

I have a fantastic county history entry for Samuel in the Wood County History. It has so many details about him and his family. I started corroborating that biographical sketch with documentary research. I set out to prove (or disprove) each point. (I’m still working on a few points that I need to do onsite research for, but it is mostly finished – and all points proven so far.) I started by making a timeline of the known information I had for him and then started adding those points from the county history as I proved them.

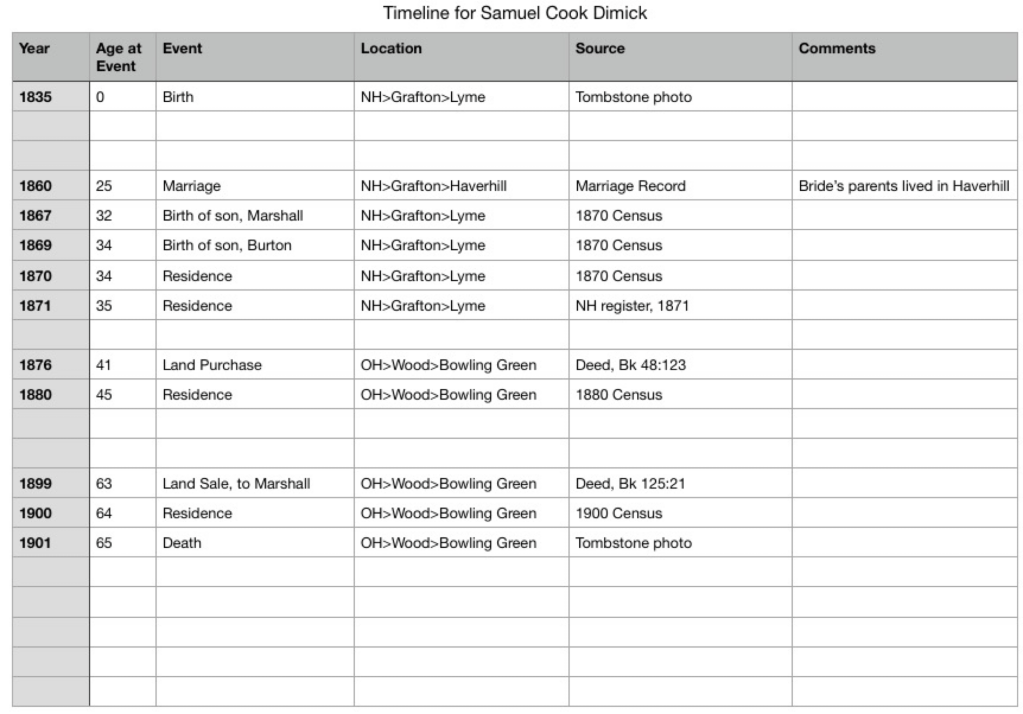
Here is an early version of the timeline. The orange box shows the gap in time between when he lived in New Hampshire and when he moved to Ohio. This is where I started asking some of those questions I mentioned in a previous blog post.

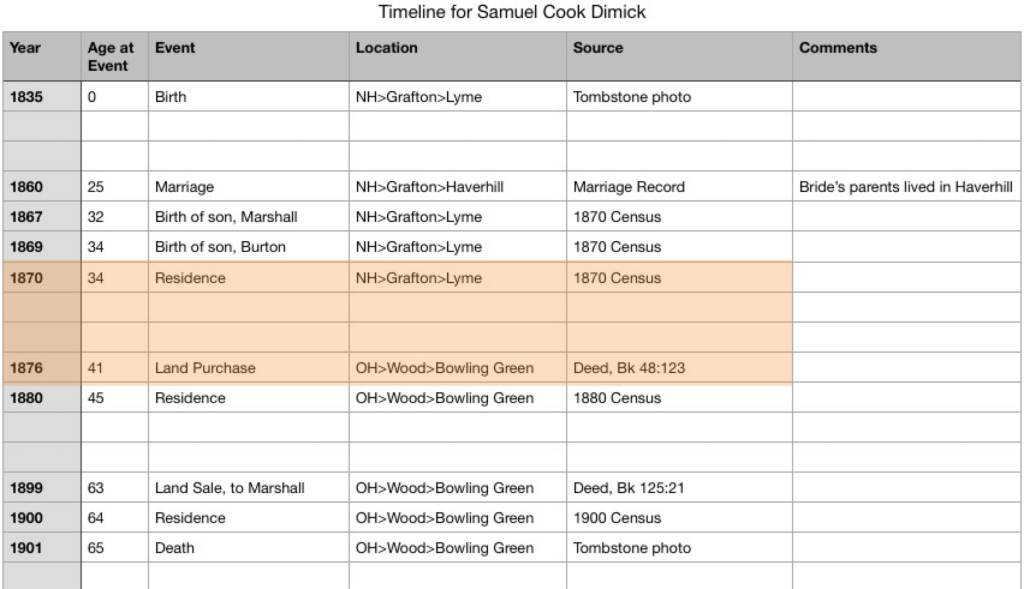
What records could I use to fill in the gaps? To keep a long research story short, I looked at a lot of records, including city directories for Bowling Green, Ohio. They do not have them for these specific years, so I was out of luck in that regard.

I reread the county history.

I’m sure none of you have ever glossed over things you read, have you? This is why it is important to go back and reread things you’ve read before. I had learned a lot since the first time going through the county history. But the answer I needed was right there in front of my face. The family lived in Toledo for a while before he moved the family to the “Old Williams Farm” in Wood County. This allowed me to go back to city directories, but this time to directories for Toledo, which is in Lucas county. Sure enough, I found Samuel live there for the roughly five-year gap.

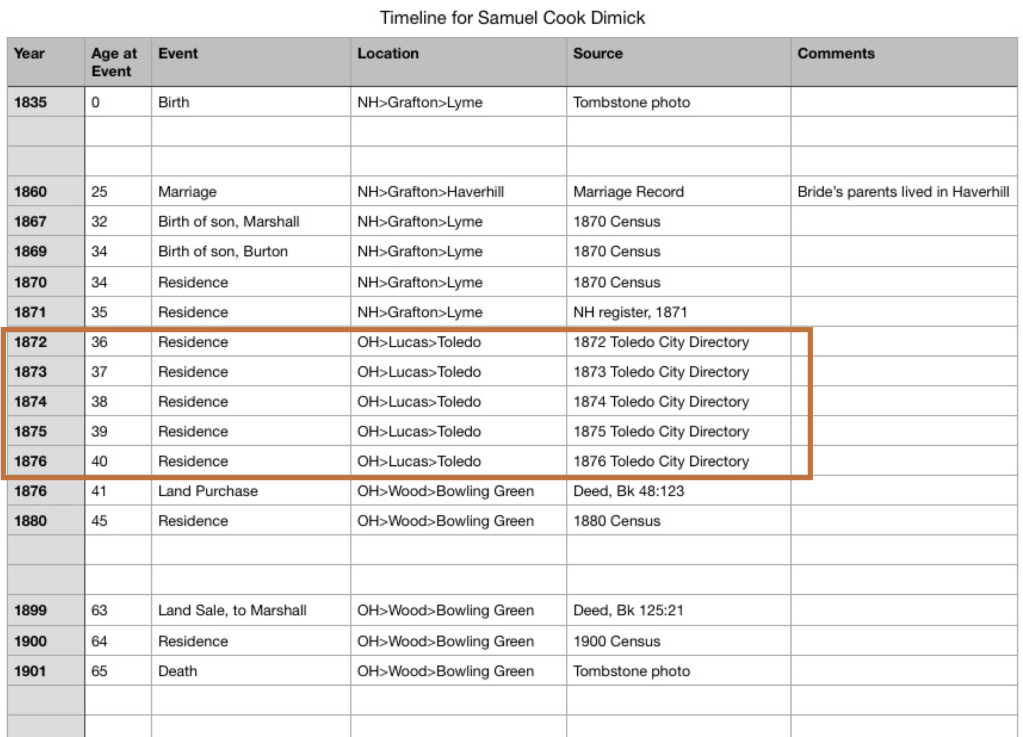
This allowed me to fill in the gap and ultimately answered the question about why the moved from New Hampshire to Ohio. The city directory shows that Samuel worked for “H. M. Clark & Co. Manufacturers of Tin and Japanned Ware.” In the 1870 census, Samuel’s occupation was in “tin.” Turns out, H. M. Clark is roughly the same age as Samuel, also born in Lyme, New Hampshire, and they served on a town council together in Lyme. So, Samuel moved to Ohio for a job opportunity.

Other research has filled in Samuel’s timeline beyond this, but the visualization of your known information allows you to get more detailed and fill in those gaps, thus building a more robust understanding of your ancestors.

Timelines: Special Projects, In and Out Tables

Sometimes in our research, we come across an ancestor who did a lot of land deals. And you may want to understand what he was up to in more detail. Putting those land records into a timeline can really help. These are sometimes called “in and out” tables and may not necessarily be intended as timelines, but if you set up your spreadsheet or table in a way that allows you to sort by date, that’s exactly what you’ve created. You can follow a particular piece of land AND you can follow a person’s land transactions.

While working on my George Long project, I needed to disambiguate two George Longs in Hancock County, Ohio. One bought and sold land frequently in that county, the other owned one piece of land. (Can you guess which one mine was?)

Here is the table. The first image shows each piece of land next to each other, color coded to match. You’ll notice that in some cases, there’s only one entry. That means I did not find the “in” or “out” deed for that land in the timeframe I was working in. The land could have been inherited or disposed by will rather than in the deed books I was looking through. More research could be done to find those. (However, this is NOT my George Long, so I don’t think I’ll be doing that research.)

The above table is organized by piece of land. However, because of how I captured the data, one click turns this into a timeline.

Timeline sorted by date.

If you are paying attention, and have read this far, you may have noticed that the first table is in fact NOT entered such that it will sort properly on the date. And if so, you get a gold star for the day. I had to go fix that for this blog post. It sorts alphabetically, essentially, so if you type of the names of the months, they will not be in proper month order. I had to go back and put the dates in by number instead of name so it would sort properly.

Couldn’t “they” have named the months in some kind of alphabetical order? I prefer the names over the numbers, myself, but that doesn’t sort right, so humbug.

Timelines: Special Projects

Timelines can also be use to visualize other types of projects or research goals. Probably the best two examples I can share from my own research are when trying to disambiguate two people of the same name (do we have one person or two?) and when trying to compare deeds for someone who did a lot of buying and selling of land (often called an “in and out” table, but they can also be timelines if you set them up in your spreadsheet to be able to sort them chronologically).

“One person or two of the same name?” is a common genealogical problem, especially in an area where a family lived for several generations. All the brothers named sons after grandpa and pretty soon, no matter how unique a name may be, suddenly there are multiple men with the same name in the same county at approximately the same time. How do you differentiate them? One tool is a comparative timeline or a “side-by-side” timeline.

Make columns for the same-named people. In my example below, we’ll just look at two to keep it simple. I then put abbreviated information in each box/cell for that person. Enough to put it in chronological order, see a location, an age, and the source. In the case below, you can see a census, tax, or deed year, a location, and an age for William Miller and William F. Miller.

An example of a comparative or “side-by-side” timeline.

In this simple example, the two men do not overlap in records or location, at least as presented in this timeline. You need to ask yourself questions to fill in any gaps and to try to prove or disprove that this is one man or two men. Some general questions I ask myself:

  • What time gaps are there that I can fill?
  • What records might fill those gaps?
  • What historical events were happening that might explain those gaps?

Some questions specific to this project I ask:

  • Can I find William F. Miller in Hardin County in the 1850 census?
  • Are tax rolls available for Hardin County where I could look for William F. Miller?
  • Can I find William Miller in Wood County in 1860 or 1870?
  • How far away are Wood and Hardin counties from each other?

Of course there are more questions and more research that could be done on the above. It is just meant to be an example. (I have my Miller ancestors squared away during this time period.)

The first set of questions work for a single timeline as well. One of my favorite examples of this has to do with my ancestor Samuel Cook Dimick. We will look at his specific timeline in a later post. By looking at data in a different way, we can see patterns or gaps that may have missed before.

Timelines: Tips for Analysis

There are some things you will want to consider when setting up a timeline for your ancestor or project.

First, how are you going to make it (special software, spreadsheet, word processor, paper and pencil)? What tools you use to create your timeline might dictate some of the next items. I like to use digital means, usually a spreadsheet or a word processor, because they are easy to add to, rearrange, sort automatically, etc. However, as a pre-computer native, I like paper and pencil. If I were going to create a timeline for a project on paper, I would suggest using notecards or sticky notes, one for each event, that you can add to and rearrange as needed.

Second, what kind of information do you want to capture. You’ll need to decide on a format so your timeline is consistent. When I am using a spreadsheet, I will tailor the columns to fit my needs for that particular project. For a general timeline for an ancestor’s life, I use these column headings:

  • Year – I usually only use the year unless I need to get more granular, then I’ll change this to a numerical sortable date system such as Year/Month/Day. You may have to work with your spreadsheet’s formatting for numbers so it appears correctly. I usually set them to “text” rather than it trying to interpret a date.
  • Age at the time of the event – I like to capture this because it often tells me something about the person or the event. If someone is paying taxes or getting married, but their age is too young or too old, then it might indicate that I’ve made a mistake somewhere.
  • Name of the event – I keep it simple when possible so “Birth” or “Marriage” usually suffices.
  • Location – Depending on what you are looking for, you might put in the place from largest to smallest or smallest to largest. For example: Lyme, Grafton, New Hampshire vs. New Hampshire, Grafton, Lyme. If I want to see all of the New Hampshire items together, I might opt for the large-to-small option.
  • Citation/source – this does not have to be a full-on polished Evidence Explained citation, but don’t skip this step. I am always second-guessing myself. I do not know how many times I’ve had to recreate my research because I forgot to note where I got a piece of information. Timelines are no different. When you find something that conflicts, you’re going to want to know where you got that information. Do something that works for you, if that’s a link to a document or database, a full citation, or simply “Samuel’s death certificate.” As long as your note tells you enough to go re-examine the record, you’re good.
  • Misc. Notes – When I am creating these timelines, questions invariably come up, or I might want to make a note about a particular event. Put in a misc. notes column to capture those ideas and thoughts.
A work-in-progress timeline for Samuel Cook Dimick.

Next we will look at some more specialized timeline set ups for various projects.

Timelines: Why?

As genealogists, we gather a lot of data. We find our ancestors in many records such as obituaries, death and birth certificates, deeds, wills, church records, tax records, military records, and so on. The list is endless. How do you analyze, process, or understand the information you’ve gathered? And if you’re working on a trickier project, say figuring out which of the 12 George Longs is your ancestor, how do you keep it all straight?

One of my absolute favorite strategies is timelines. Creating a timeline for your ancestor puts his or her life into context and perspective. Obviously (or maybe not), a timeline is a list of events in chronological order. They show the “lifespan” of an individual, a place, or an historical event. Depending on what your goals are, you can create timelines with different focuses. The two main focuses I use are event-focused or document/source-focused.

Each document was created on a date (sometimes you know that date because it is written on the document, sometimes you might have to make an educated guess based on context). By putting together a document-focused timeline you can assess your research and make a plan for any research holes you find.

Document-focused timeline

Documents or sources may list multiple events. A death certificate, for example, will list a date of death, but also may list the birth date, the burial date, the onset of an illness, the date of a coroner’s inquest, etc. An event-focused timeline pulls all those dates out.

Event-focused timeline

As you enter your data into your genealogical software or online tree, if you use them, they may automatically put the events in chronological order, helping you to visualize your ancestor’s life. When I get deep into a project, however, I tend to work in a spreadsheet or word processor so I can reorder things, put in items that may I may not want in my software, add historical context items, and link citations.

Next, we will look at using timelines to compare and analyze your research.