Tag Archives: tools

Top Tools I Use: Project Management

I have a lot of irons in the fire at any one time. Between client work, volunteer positions, speaking arrangements, and personal projects, I have a lot to keep track of. There are a lot of tools that can be used for this. I like Asana. It allows me to make categorized lists, with subtasks, and calendar reminders.

asana1

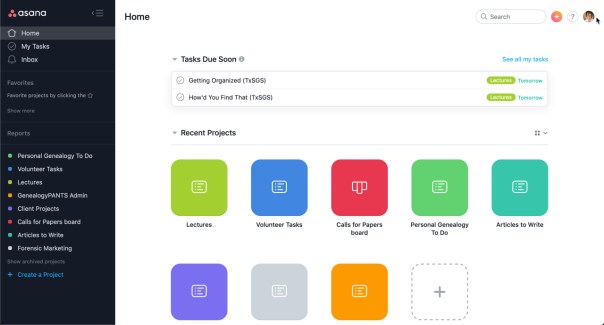
I find the interface to be easy to understand and set up. In the image above you can see some of my categories: Lectures, Volunteer Tasks, Calls for Papers, Personal Genealogy, Articles to Write. I also have a category for Client Projects, general business admin, and so on.

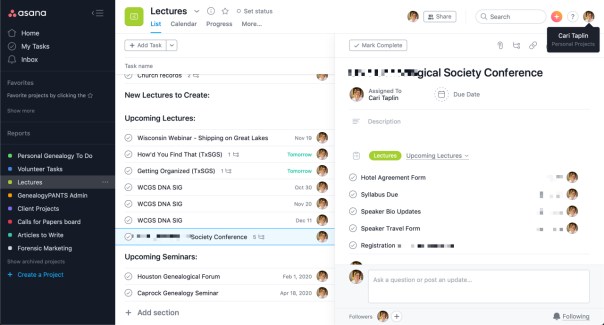
The sub-tasks allow you to keep track of more details. I use this most when there are smaller tasks to be finished as part of a larger project. For example, in the image below, you can see that I for upcoming speaking agreements, I keep track of when various contracts, forms, bio and headshot, syllabus and other materials are due. I also keep track of whether I’ve made travel and hotel arrangements, and any other details. You can also attach files and links.

asana2

Asana makes completing your to-do items fun by also playing cute animations when you click off your items.

gamification-asana-unicorn

There are many online videos, tutorials, and help files that help you get into the details of Asana. See some of these for more:

Tools like Asana can help you stay on top of all of your tasks. With so many tasks, projects, and responsibilities, I couldn’t live without it. Well, I could, but I’d be much more disorganized.

Top Tools I Use: Screenshots

As a speaker, I often find myself needing to make screenshots, and annotate them with arrows or underlines. I also often use screenshots in client reports to help educate or inform the client. It is also handy to be able to add screenshots to emails, research logs, notes, and more. My favorite screenshot tool is Snagit by TechSmith (not an affiliate link).

snagit

In the above screenshot, you can see the interface. In the large part of the screen is the working surface. The screenshot can be annotated by adding arrows, boxes, text, blur (to retain privacy), and other shapes. Along the bottom is a deck of previous screenshots. And along the right side is the menu where you can choose your tools, determine how wide or narrow the lines should be, the colors, and so on.

One of the things I use it for in my personal research is to create a list from a database, such as a list of hits in a census search, and then using the screenshot tool to keep track of what I looked at and which can be eliminated. The following is an example from a search for “Renfro” in Barren County, Kentucky in the 1850 census.

example-snagit

There are other features that I have not used as much such as video capture, that could be used if you wanted to demonstrate using a website or something along those lines. The TechSmith website has excellent tutorials and help pages.

I find Snagit to be very easy to use, intuitive, quick, and handy. There are probably others screenshot tools out there that you enjoy. The main point here is not necessarily to use Snagit itself, but to bring attention to how useful a screenshot tool can be. I use it nearly every day, largely to create slides in my presentations.

The screenshot can enhance whatever you are working on by providing more explanation to your audience or yourself through the use of arrows, lines, boxes, text, and more.

Top Tools I Use: Charting

I have had people ask me about various tools when I teach classes or deliver lectures/seminars that I thought I’d share some of those through my blog along with any tips I think of along the way. Enjoy!

Once you get past your basic pedigree or family group sheet, and especially when working on DNA projects, genealogists find themselves wanting to make a chart that is more complicated and/or more customizable than most genealogy software offers. I have used simple text and boxes in Mac Pages (same can be done in Word), Keynote (same can_LucidChart 
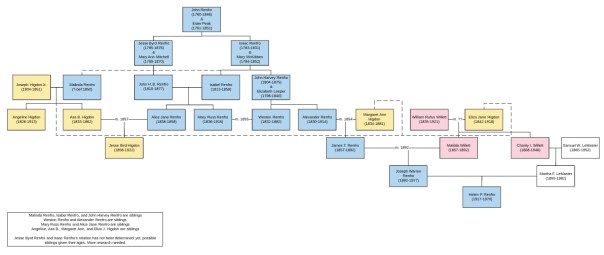
be done in Powerpoint), and various drawing programs. A friend introduced me to LucidChart and I’ve never looked back! (NOTE: This is NOT an affiliate link or anything. I do NOT get any kind of compensation for sharing this information.)

Lucidchart is very easy to use, intuitive, versatile, and did I say easy? The workspace is very intuitive.

_LucidWorkspace

You can easily add shapes, put text into those shapes, fill the shapes with color, connect the shapes with lines, put text onto the lines, and so much more. There are options for what file type to download your chart as, sharing with others, creating slides for a presentation, and many other fancy options.

I won’t go into the details of how to do everything. There are many resources for learning more about Lucidchart. They have an excellent help section on the website and they have a YouTube channel that features helpful tutorials and some funny videos that demonstrate Lucidchart features.

In genealogy, we run into “pedigree collapse” quite frequently. Pedigree collapse happens when cousins marry cousins such that on two (or more) branches of your family tree you find the same ancestral couple. For example, my parents are fourth cousins. Back in the tree the Meeker family lived next door to the Avery family, and four Avery siblings married four Meeker siblings. So two ancestral couples are actually the same ancestral couple, I have Mahlon Meeker and Frances Cooper on both my mother’s side and my father’s side.parentsrelated

Sometimes this sort of thing gets much more complicated. I am currently working on a project to figure out how the Higdons and the Renfros (and the Renfros) are related. Take a look:

HigdonRenfro-demochart

Now, I know you probably can’t read that text. The point is not to help me with my research project (though if you have Higdons or Renfros in Missouri and Kentucky please email me), but to show you how complicated a chart can get and how easy it is to demonstrate it with Lucidchart. (The yellow boxes are Higdons, the blue are Renfros, and the pink are Willetts. Several Higdons married the Renfro cousins and several Renfros married their Renfro cousins.) And I also know genealogists and you probably REALLY want to see that text. You can see this chart on Lucidchart here.

I use Lucidchart nearly everyday when I’m working on projects for my personal work and for clients. I don’t know what I’d do without it. There is a free level and a subscription level as well. I did very well with the free level for quite some time.

Lucidchart is not the only charting game in town. You might have a tool you prefer. But if you have been struggling with charting, you might give Lucidchart a try. I highly recommend it.