Monthly Archives: May 2022

Maps: Visualizing Your Ancestors – More Thoughts on Topographical Maps

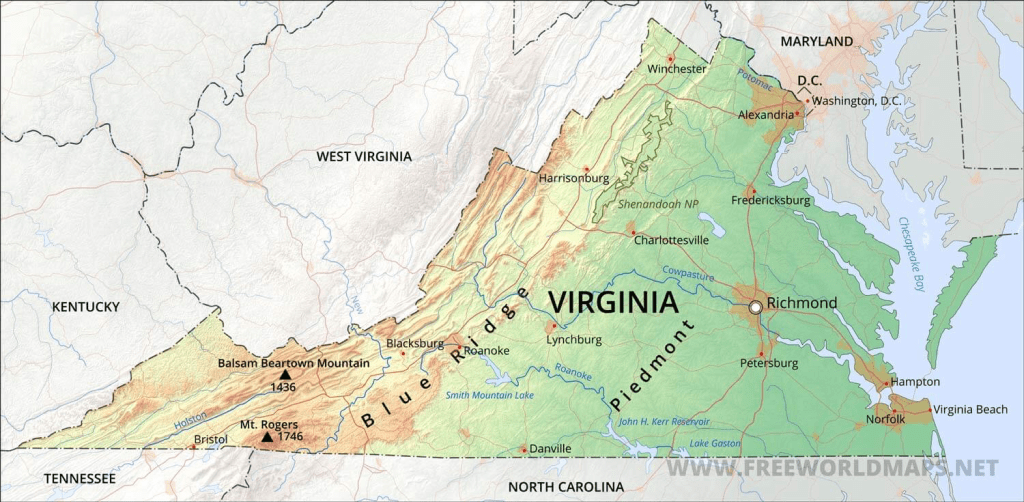
Last time we talked about topographical maps and using them to understand why ancestors might have migrated one way over another. Primarily looking at large land formations, like mountains. Let’s look at a topographical map on a smaller scale.

When you are looking at a topographical map, you will see lines that indicate changes in elevation, and if you “squint” at the map you can kind of imagine how flat or hilly an area might be. A topographical map shows you the contours of the land indicating mountains, valleys, rivers, vegetation (or the lack thereof), and other features. On a topographical map, you will see large swathes of green for vegetation, blue areas for water, grey areas for buildings and built-up areas. However, the contour lines tell the story of the three dimensional nature of the landscape.

Depending on the map, there will be a key that tells you at what elevation another contour line will be placed on the map. For example, if the map you are looking at uses a 10-foot contour spacing, then you will see a contour line for every 10 feet of elevation change. (i.e. a line will be in place at 0-, 10-, 20-, 30- foot change. A map might use a larger scale if the land is very elevated, showing the Rocky Mountains, for example. The lines on the map are only drawn for every interval of change, so every 10 feet, for example. If you have a relatively flat area of land, the map might be quite blank of the contour lines.

Let’s look at two examples. The map on the left is in Audrain County, Missouri, the map on the right is in Wood County, Ohio.

Topographical maps of Audrain County, Missouri on the left and Wood County, Ohio on the right.

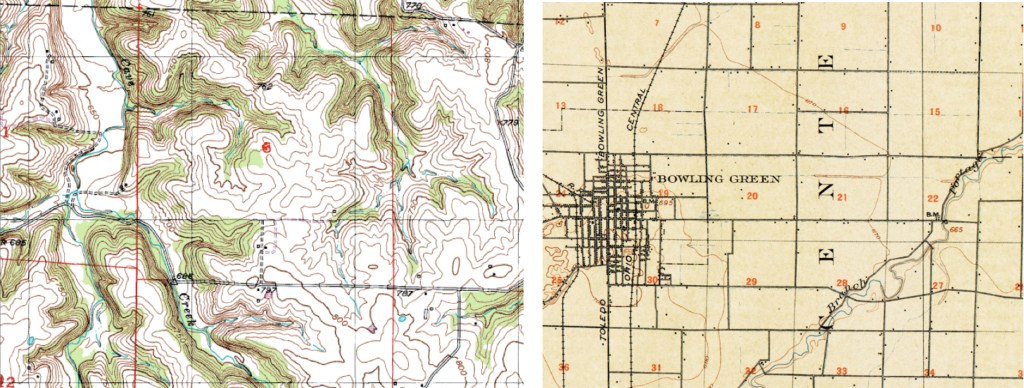
You can see the difference in the land shapes even though I’ve zoomed in a different levels. Wood County, Ohio is very flat, whereas Audrain County, Missouri is much more hilly. I have ancestors that farmed on land from both of these maps. And each map gives me a bit of a different picture of how that farming might have happened. Audrain County land probably couldn’t farm right up to the river banks due to the steepness and vegetation. Those green areas indicate a lot of trees and vegetation where the white areas were clear and flatter, better for farming. And while there are some swaths of trees in Wood County, most of the thickest parts have been cleared out and the land is largely flat farm land for miles.

We will learn about where to find topographical maps next time.

Maps: Visualizing Your Ancestors – Types of Maps – Topographical

When it comes to understanding ancestral migration patterns, it really helps to look at a map. The reason an ancestor ended up in a certain location might be explained by geography, and more specifically, topography. Using a topological map can be quite helpful in understanding some of the potential “whys” for things our ancestors did.

Topography is “the arrangement of the natural and artificial physical features of an area.”1 Examining the physical features can explain a possible migration route or why they stayed in a particular location.

One excellent example of topography affecting migration is that of large mountain ranges. Let’s look at Virginia as an example. Let’s say you had ancestors in early Virginia and they wanted to move west to the “frontier.” They set off past Richmond only to discover a large mountain range in front of them. The Blue Ridge Mountains caused a lot of adventurous folks to head north or south to go around them.

Map of Virginia from FreeWorldMaps.net

This barrier caused more settlements to the north and south. As I imagine it, you make a long journey to get around these mountains…why not just stop here a spell? And then just never leave. I imagine that happened quite a bit.

My ancestor, Samuel Cook Dimick, moved from Lyme, New Hampshire to Toledo, Ohio. One account says that after the business he was working for began shutting down (or he decided to quit working there, it isn’t clear) he was to move on further west (perhaps to Minnesota where his father owned some land). But someone told him of land for sale just one county to the south and he decided to stay in Wood County, Ohio. And that’s the reason I was born in Wood County, Ohio and not Lyme, New Hampshire.

We will continue our look at types of maps that can help us understand our ancestors’ decisions and circumstances next time.


1. Definition of “topography” from Oxford Languages (https://languages.oup.com/google-dictionary-en/)↩

Maps: Visualizing Ancestral Migrations

To understand our ancestors’ movements and decisions, sometimes consulting a map can clear up confusion. I have a simple example from my own research.

One of my favorite lines to research are the Dimicks. They moved from Massachussetts to Connecticut to New Hampshire and then later to Ohio. I find that I try to do too much in my head sometimes. My brain likes to try to convince me that I can remember things…corrrectly. Well, this demonstration just goes to show two things. One, I can’t remember much very well, and two, using a map is invaluable.

Here’s how I “thought” their migration went:

Gif demonstrating my imagination of how the Dimicks migrated.

It is an unusual migration pattern to cross back over a state you’ve already left. It’s not unheard of or impossible, of course, but usually, people migrated in more of a straight line. This realization got me to look at the exact locations of the Dimicks in each location.

When the Dimicks arrived in America in the 1600s, they lived in Barnstable, Massachussetts, which is located out on the hook of Massachussetts. Now this migration makes more sense:

The actual migration path of the Dimicks.

By looking at a map, instead of depending on my memory, the Dimick migration makes a whole lot more sense. This is now one of the first things I do when working on a project. I look at maps and get a good visual perspective on where all of the people involved were located.

There are several types of maps that can be useful for this. We will look at them in more detail next week.

Maps: Visualizing Your Ancestors

Several things have come together recently that have prompted me to focus on maps and genealogy. First, you may or may not know that I run some study groups along with my friend and colleague, Cyndi Ingle (of Cyndi’s List). One of the groups studies National Genealogical Society Quarterly (NGSQ) articles. The article we read for the May study group was “Southern Strategies: Merging Identities by Mapping Activities and Linking Participants—Solomon Harper of South Carolina’s Lowcountry” by Rachal Mills Lennon. This was an excellent example of using maps and locations to not only track ancestors but, in this case, to prove that was believed to be several men, was actually one man through the use of locations and connected associates.

Second, I just recently gave a workshop on using Google’s MyMaps for analyzing and planning to the Colorado Genealogical Society. This is a workshop I give frequently and throughly enjoy because I demonstrate to participants how easy, exciting, and beneficial it can be to use Google’s MyMaps to analyze ancestors, plan research trips, or work on a personal narrative.

Third, I recently worked on a client project that depended on the proximity of two families to each other, and I used some maps to share that information with the client.

Throughout my workday I am consulting maps, especially for areas that I am not familiar with. In many cases, I am looking to see how close one county is to another and asking, is it possible that this family intersected with that family? Are those two counties reasonably close or are they on opposite sides of the state? Are these two counties close together even though they are in different states?

This confluence of activities will inspire the next series of posts on this blog and we will focus on using maps. Primarily, using maps to visualize your ancestors’ lives, locations, and migrations. We will take a look at some map collections, I will provide some examples from my own research, and we will look at using Google’s MyMaps to make your own maps as well.