Category Archives: maps

Maps: Visualizing Your Ancestors -Rectangular Survey

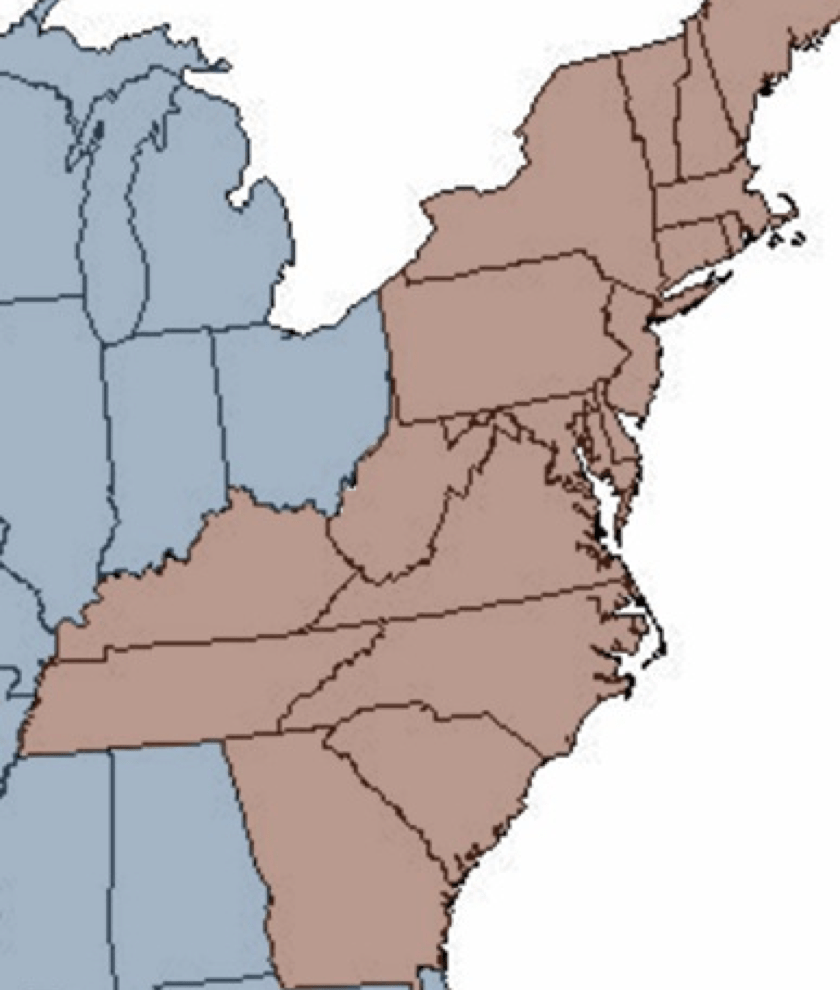
Last time we talked about the metes and bounds survey system that was used in the eastern states (colonies prior to our nation’s creation). This time let’s look at the survey system used the the rest of the United States, in the public lands states, called the “rectangular survey system.”

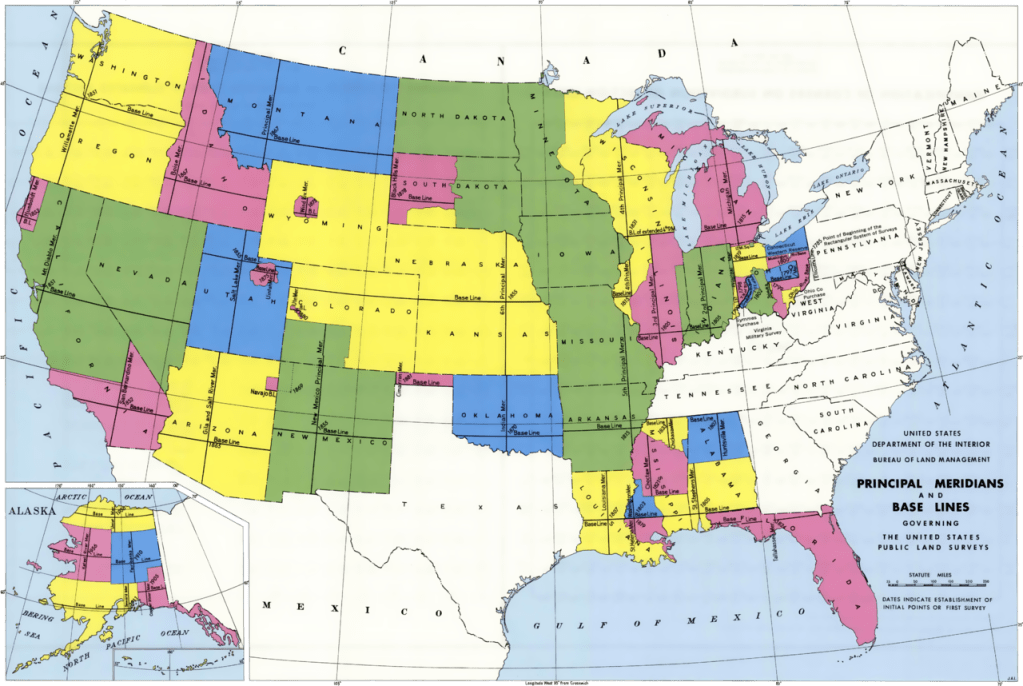
This survey is based on a grid system using a series of baselines and meridians across the U.S.

USGS BLM Map of Baselines and Meridians

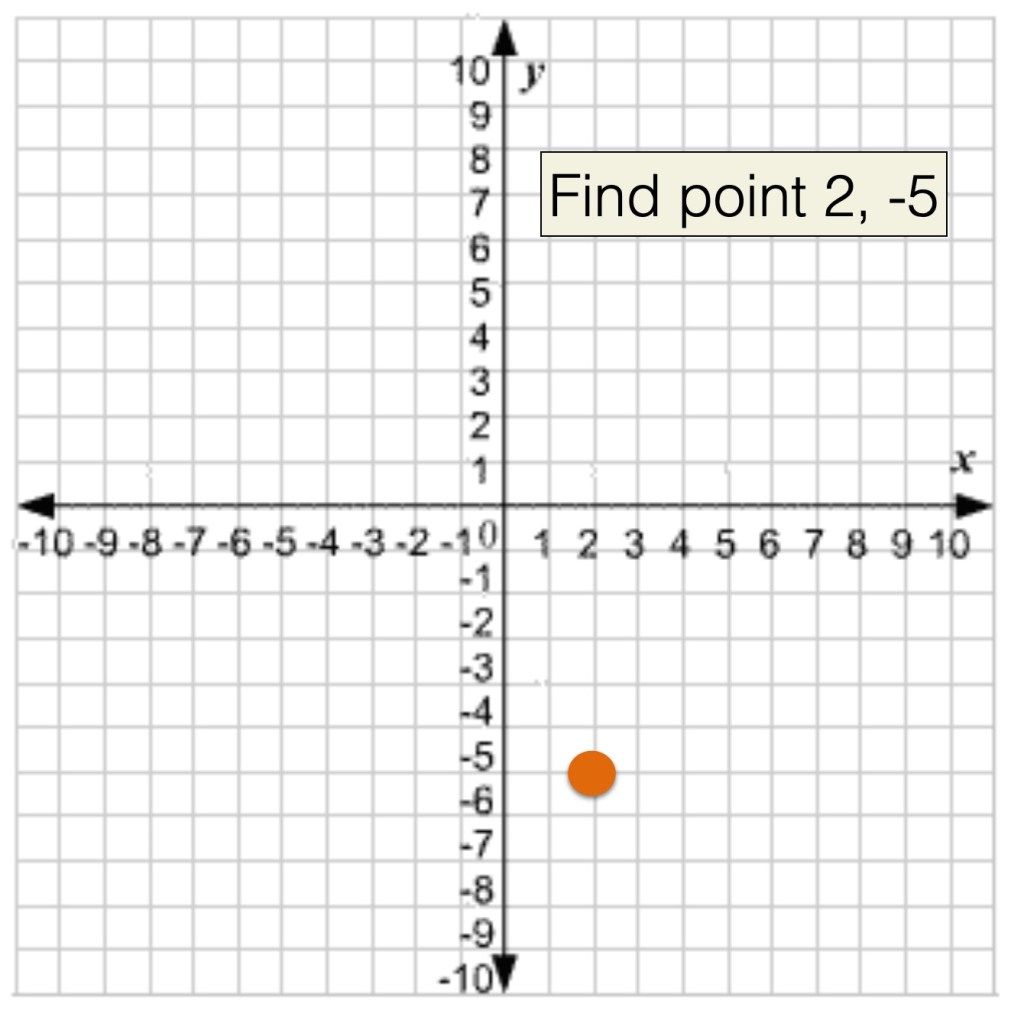
If you ever learned about how to find a point on a grid in math class you, learned that (2, -5) meant that you go right 2 points on the X axis, and down 3 points on the Y axis.

Grid system from math class.

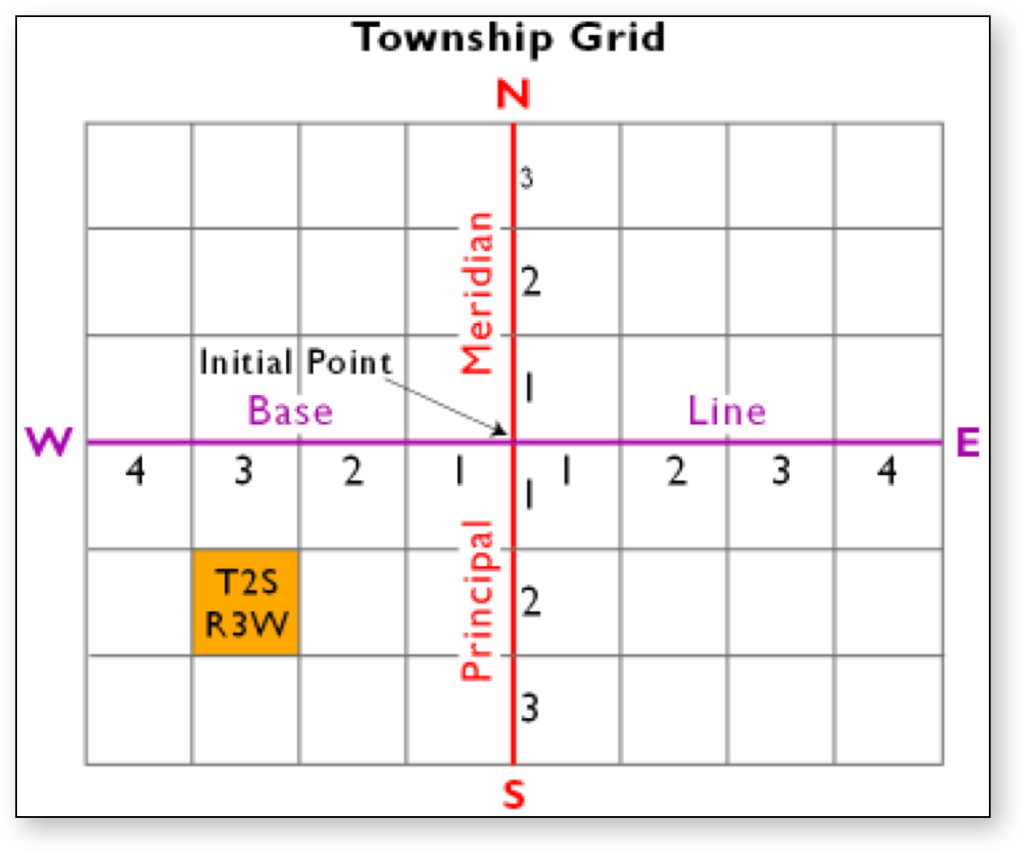
The rectangular survey works the same, except that we use the cardinal directions instead of positives and negatives, and the directions are referred to as townships and ranges such that a square from the grid is called “township 2 south, range 3 west.’ Each of these township/ranges is 36 square miles.

Example showing the location of township 2 south, range 3 west

But wait, there’s more…

Inside each one of those township and ranges, the land is further subdivided into 36 1-square mile sections, numbered 1-36. AND THEN, each one of those 1 square mile sections is further divided into “aliquots.” Those smallest sections are divided into halves or quarters depending on how many acres someone received.

The rectangular system divisions.

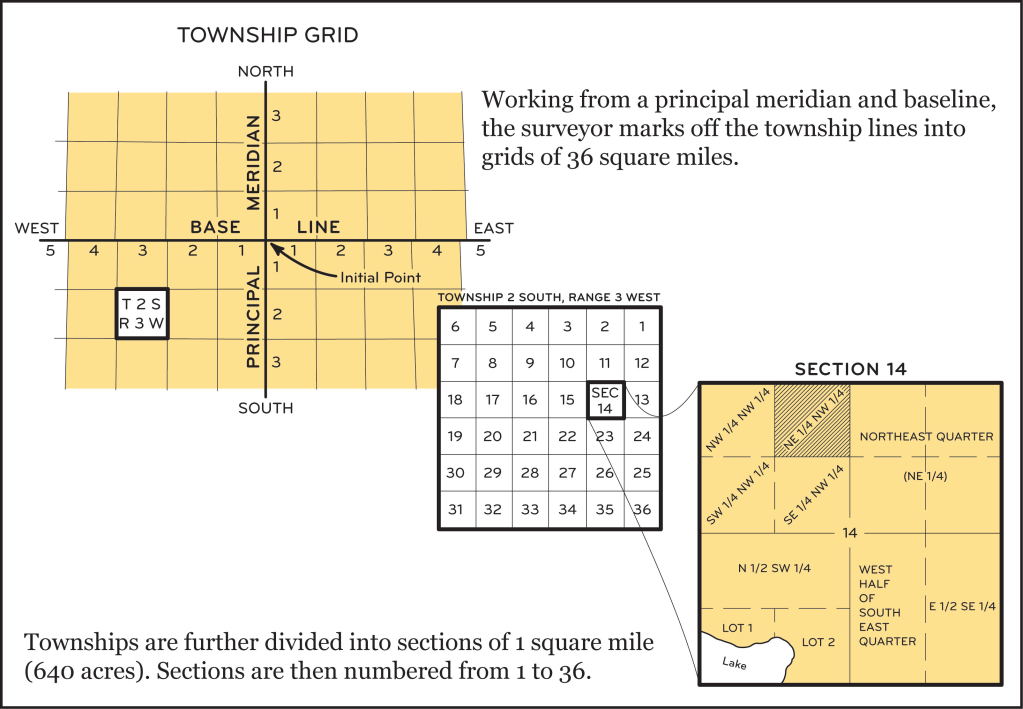
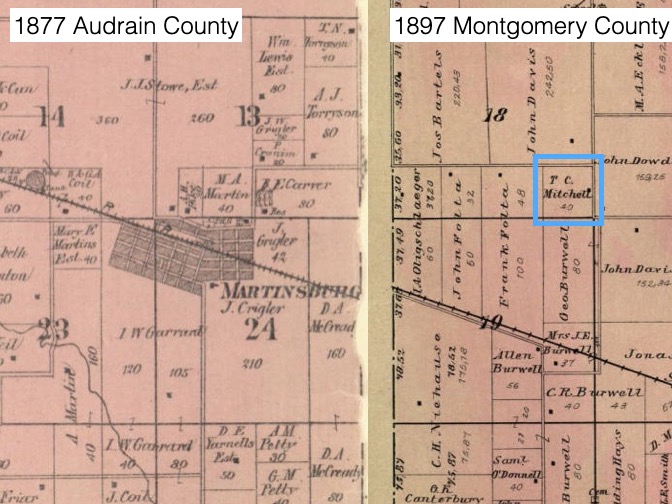
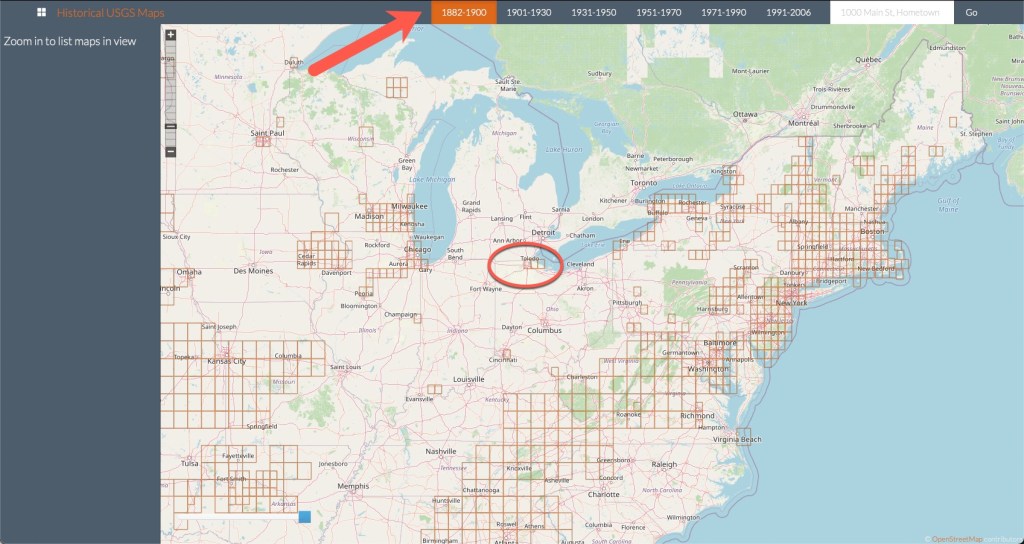
So, when you find a land description for a rectangular survey system piece of land, it will read like this: N 1/2, SW 1/4, of section 14 in township 2 s, range 3 w (or north half of the southwest quarter of section 14 in township 2 south, range 3 west). The land description might also mention the principle meridian though not always. From context of where the land is located, you can often figure it out without naming the meridian (refer to the first map in this post).

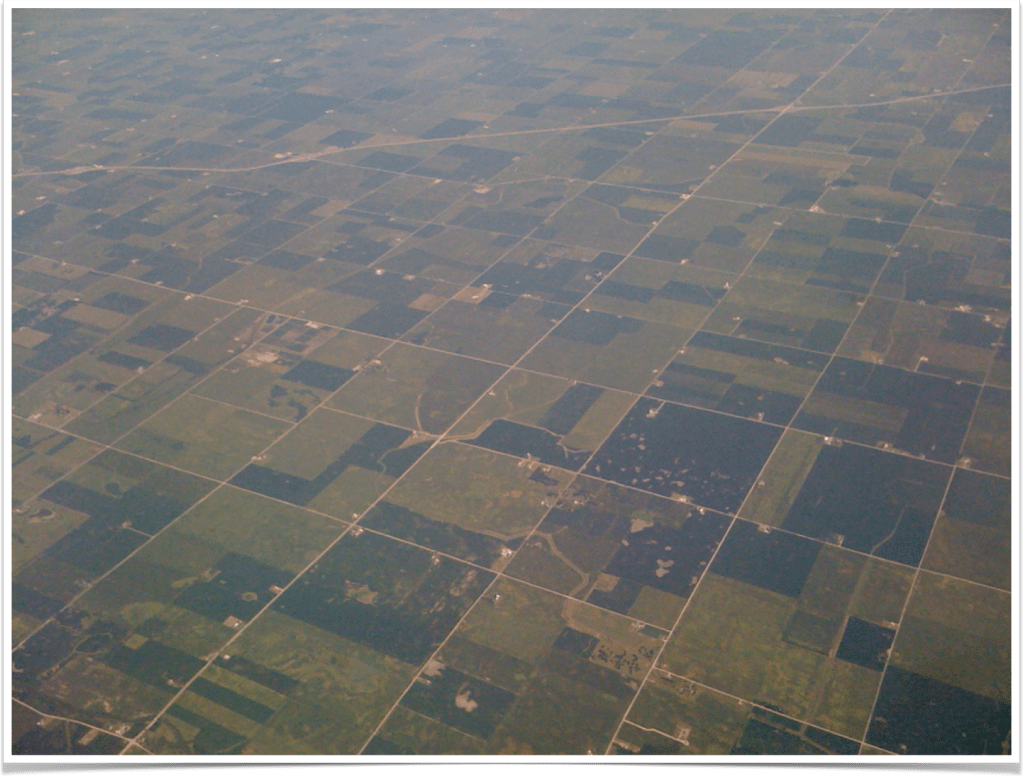
It is because of this grid system of surveying that this is the view out your airplane window when you fly over the midwest:

Photo by author.

Maps: Visualizing Your Ancestors – Land Descriptions

When working with ancestral land records, there are a few things you need to know in order to attempt to find your ancestors’ land on a map. In the United States there are two types of land surveying systems. They are known as the “state land states” which use the “metes and bounds” system, and the “public land states” or the “federal land states” which use the “rectangular” survey system.

The states that fall into the state land state category are those states created from the original thirteen colonies and Hawaii and Texas. (As a side note, Texas has its own land survey system because Texas was a country of its own before joining the U.S., with their own survey system already in place. See the Texas General Land Office for more information.) Those states are:

  • Connecticut
  • Delaware
  • Georgia
  • Hawaii
  • Kentucky
  • Maine
  • Maryland
  • Massachusetts
  • New Hampshire
  • New Jersey
  • New York
  • North Carolina
  • Pennsylvania
  • Rhode Island
  • South Carolina
  • Tennessee
  • Texas
  • Vermont
  • Virginia
  • West Virginia
The states in red in the map above are State Land States, plus Texas and Hawaii.

The land obtained by individuals for the first time usually was given by the colony or state. Records for those first land grants are kept at the state level, usually at a state archive, though the locations will depend on the state. Again, the state land states were surveyed using the “metes and bounds” survey system.

The Federal land states or “public land states” was land obtained by the federal government after independence. This means the rest of the United States. Primarily the land west beyond the Appalachian Mountains. After the Revolutionary War, land claimed in this western portion by state land states were ceded to the federal government. Additionally, the United States obtained land through various means such as the Louisiana Purchase, the War with Mexico (1846-1848), and so forth.

The land in the public land states would then be granted to individuals by the federal government. Those records are held at the national level, and many are digitized and available at the Bureau of Land Management General Land Office website. The land in the public land states were surveyed using the “rectangular” survey system.

Map from Bureau of Land Management. This map shows the Principle Meridians and Baselines used in the rectangular survey system.

When looking at a land description, you can usually determine quite quickly if you’re reading a metes and bounds or a rectangular survey. We will discuss the metes and bounds system next and the rectangular system after that.

Maps: Visualizing Your Ancestors – Types of Maps – Bird’s Eye View

One of my favorite types of maps, especially for enhancing your imagination when thinking about your ancestors, is the bird’s eye view map. These are intricately drawn maps were popular in the late 1800s and early 1900s to depict towns and cities from above. These maps might be called other names such as panoramic maps, perspective maps, or aero view maps.

These maps may not be drawn to scale but rather they depict streets, buildings, waterways, and city life. Many of these are so intricate that if you zoom in you can see horses and buggies, names on the ships in the harbor, people walking, and more. They are art the informs our ancestors’ surroundings. For me, they are almost like stepping into a time-travel portal. Almost. They are so much fun to look at and imagine with.

Here are a few zoom-ins on some of my favorites:

Zoomed in on Bowling Green, Ohio, 1888, with Oak Grove Cemetery in the upper right corner, Library of Congress
Zoomed in on Alexandria, Virginia, 1863, with names on steam ships, horses and buggies, and people on the pier, Library of Congress.
Zoomed in on Toledo, Ohio, 1876, showing the industry along the Maumee River, the Chief Justice Waite side-wheel steamer, and the swing bridge to let ships pass, Library of Congress.

I could go on… instead. I encourage you to visit the Library of Congress collection of panoramic maps or any online map repository, and see the fun for yourself!

Maps: Visualizing Your Ancestors – Types of Maps – Migration

When my ancestors moved from Lyme, New Hampshire to Toledo, Ohio, what route might they have taken to get there? Given the time period, there might be several ways our ancestors could have gotten from point A to point B. Lyme is northeast of New York and the Erie Canal. When they moved to Ohio, the Erie canal was up and running. They could have taken a train or a wagon south from Lyme, then used the Erie Canal to travel to Buffalo, New York. From there, a steamship on the Great Lakes to Toledo is a viable route. This is the one that I like to think they probably took. However, without a diary, letters, or ticket stubs, I’ll never know. But we can make some inferences by looking at map and researching the routes.

There are a lot of different types of transportation that could come into play when assessing the options for your ancestors’ migration:

  • Indian Trails
  • Wagon Routes
  • Train Lines
  • Canals
  • Steamships
  • Roads and Interstates

When I try to decide how my ancestors may have moved across the country, I first try to find a map as close to the time of their movement as possible. I’ll try to find a couple of maps that show various different types of transportation.

For example, Samuel Cook Dimick moved his family from Lyme, New Hampshire, I set out to determine how they may have moved.

Base map from the National Park Service, Annotations by author.

Lyme, New Hampshire is approximately where the blue star is. They then would have made their way to Albany, taken the canal to Buffalo, then a steamship on Lake Erie to Toledo. How might they have gotten to Albany?

“Railroad map of New Hampshire accompanying report of the railroad commissioners, 1894.” From the Library of Congress.

This map is from 1894, it is not perfect, but it is near the time that they moved to Ohio. There appears to be a rail line that follows the Connecticut River south. They could have boarded near Lyme at a depot. Lyme is on the river. (Here is a link to the map at the Library of Congress so you can zoom in and scroll around.) Then you would just look for a similar map for Vermont, and Massachusetts and New York, until you’ve examined all of the possible rail lines.

What about when they made it to Lake Erie?

Map of Great Lakes, showing routes of travel and places of interest. Alfred D’A. McNevin, [1915]. Library of Congress Geography and Map Division.

They moved to Toledo, Ohio; travel via the Erie Canal and Lake Erie seems most reasonable. But there were other options. What about wagon roads? Wagon roads were built on top of old Indian trails. Eventually they became well-known highways and interstates.

Old Lake Shore Trail is now Interstate 90 along Lake Erie.

It is a fun imagination exercise to try to determine the possibilities. Maps are a great way to do this kind of exercise.

Next time, we will look at one of my favorite kind of maps: the bird’s eye view!

Maps: Visualizing Your Ancestors – Types of Maps – Plat Maps

One type of map that can be helpful to pay attention to are boundary maps. I’m usually focusing at the county level. I have a couple of ancestors who were “border dwellers” meaning they lived on or near a county boundary. Sometimes I find records for them in one county, sometimes another. What is going on there? Did they move? Or did the county boundary change? OR, a third option, was the nearest courthouse in the next county over? Some court actions did not have to be in the county where a person lived so it may have been more convenient to go to a neighboring county to file that record.

I usually use a county map that is at least at the township level, and I typically use them in conjunction with a landowner map. You have to know where exactly in the county (and township) someone lived to understand if they moved or if the boundary changed.

One of my favorite ancestors to research is Thomas C. Mitchell. After the Civil War, he lived in Montgomery County, Missouri, but right on the border with Audrain County.

Two landowner maps showing T.C. Mitchell’s proximity to the border.

Sometimes you cannot find a map for exactly the right time frame. Simply find the next closest and use that for your comparisons and analyses. In my example above, you can see the map on the left is from 1877 Audrain County and the map on the right is 1897 Montgomery County. I lined them up as best as I could using the train line as a guide.

These township maps show you the section numbers; Thomas lived in section 18 in that particular Township/Range. We know that each section is one square mile. That means that Thomas lived about 1.5 miles from the nearest town of Martinsburg. If he could do the business he needed to do, you can bet that he did it in Martinsburg. I have found many records for Thomas in Audrain County even though he lived in Montgomery County.

If your ancestor never moved but the county boundary changed, you have to look for records in both counties. The county clerks did not sit down and divvy up the records according to those that lived in the new county. They just kept the records in their original location. So, for border dwellers, always be checking nearby counties. A landowner and county boundary map can help you decide in which counties to look.

More map types next time…

Maps: Visualizing Your Ancestors – Finding Topographical Maps

One of my first places to look for topographical maps is the United States Geological Survey (USGS) website. Beyond just being a cool site to check out, it offers all kinds of digital maps. We will focus on the topographic (topo) maps for today, but I encourage you to check the site out for general interest if nothing else.

USGS Website – Scroll down the page
Find the topographic maps section.

When you click on that Topographic (topo) Maps section, you will be taken to an interactive map. Simply type in a location in the upper right search box, or click anywhere on the map and zoom in to find your location. A list will appear below the search box showing you all of the maps they have published for that area. When I searched for Lyme, NH, I found maps for the area going back to 1933.

Lyme, New Hampshire Topo map from 1933, showing “Demmick Hill”

Above is the section of the map showing Lyme where my Dimick ancestors lived. There is even “Demmick Hill” on the map where they used to cut ice blocks out of “Pout Pond” and slide them down the hill to town for people to use in their ice boxes before refrigeration. Because of this topo map, I can see where this event occurred with a better visualization of the landscape.

Another site to try is TopoZone.com. They also use the USGS maps, but you might find their search or website tools easier to use. For example, they have layers that you can turn on and off that might help you enhance what you are looking for.

Topozone Map of Lyons, Colorado, showing the layer options.

Another site that uses the USGS as well as other historical maps is called “Historical USGS Maps” and this site puts all of the maps on a large interactive map. You simply zoom in and move around to see what is available. Along the top they have a timeline so you can see the time periods for the maps available.

Historical USGS Maps example, showing timeline at the top and circling maps in the Toledo, Ohio area.
As you zoom in, the maps available appear, overlaid on the main map.

You can find websites for other countries as well (not at all meant to be an all-inclusive list, just some I’ve run across in my research):

Be sure to use Cyndi’s List for links to maps (and other topics). We will look at plat maps next time.

Maps: Visualizing Your Ancestors – More Thoughts on Topographical Maps

Last time we talked about topographical maps and using them to understand why ancestors might have migrated one way over another. Primarily looking at large land formations, like mountains. Let’s look at a topographical map on a smaller scale.

When you are looking at a topographical map, you will see lines that indicate changes in elevation, and if you “squint” at the map you can kind of imagine how flat or hilly an area might be. A topographical map shows you the contours of the land indicating mountains, valleys, rivers, vegetation (or the lack thereof), and other features. On a topographical map, you will see large swathes of green for vegetation, blue areas for water, grey areas for buildings and built-up areas. However, the contour lines tell the story of the three dimensional nature of the landscape.

Depending on the map, there will be a key that tells you at what elevation another contour line will be placed on the map. For example, if the map you are looking at uses a 10-foot contour spacing, then you will see a contour line for every 10 feet of elevation change. (i.e. a line will be in place at 0-, 10-, 20-, 30- foot change. A map might use a larger scale if the land is very elevated, showing the Rocky Mountains, for example. The lines on the map are only drawn for every interval of change, so every 10 feet, for example. If you have a relatively flat area of land, the map might be quite blank of the contour lines.

Let’s look at two examples. The map on the left is in Audrain County, Missouri, the map on the right is in Wood County, Ohio.

Topographical maps of Audrain County, Missouri on the left and Wood County, Ohio on the right.

You can see the difference in the land shapes even though I’ve zoomed in a different levels. Wood County, Ohio is very flat, whereas Audrain County, Missouri is much more hilly. I have ancestors that farmed on land from both of these maps. And each map gives me a bit of a different picture of how that farming might have happened. Audrain County land probably couldn’t farm right up to the river banks due to the steepness and vegetation. Those green areas indicate a lot of trees and vegetation where the white areas were clear and flatter, better for farming. And while there are some swaths of trees in Wood County, most of the thickest parts have been cleared out and the land is largely flat farm land for miles.

We will learn about where to find topographical maps next time.

Maps: Visualizing Your Ancestors – Types of Maps – Topographical

When it comes to understanding ancestral migration patterns, it really helps to look at a map. The reason an ancestor ended up in a certain location might be explained by geography, and more specifically, topography. Using a topological map can be quite helpful in understanding some of the potential “whys” for things our ancestors did.

Topography is “the arrangement of the natural and artificial physical features of an area.”1 Examining the physical features can explain a possible migration route or why they stayed in a particular location.

One excellent example of topography affecting migration is that of large mountain ranges. Let’s look at Virginia as an example. Let’s say you had ancestors in early Virginia and they wanted to move west to the “frontier.” They set off past Richmond only to discover a large mountain range in front of them. The Blue Ridge Mountains caused a lot of adventurous folks to head north or south to go around them.

Map of Virginia from FreeWorldMaps.net

This barrier caused more settlements to the north and south. As I imagine it, you make a long journey to get around these mountains…why not just stop here a spell? And then just never leave. I imagine that happened quite a bit.

My ancestor, Samuel Cook Dimick, moved from Lyme, New Hampshire to Toledo, Ohio. One account says that after the business he was working for began shutting down (or he decided to quit working there, it isn’t clear) he was to move on further west (perhaps to Minnesota where his father owned some land). But someone told him of land for sale just one county to the south and he decided to stay in Wood County, Ohio. And that’s the reason I was born in Wood County, Ohio and not Lyme, New Hampshire.

We will continue our look at types of maps that can help us understand our ancestors’ decisions and circumstances next time.


1. Definition of “topography” from Oxford Languages (https://languages.oup.com/google-dictionary-en/)↩

Maps: Visualizing Ancestral Migrations

To understand our ancestors’ movements and decisions, sometimes consulting a map can clear up confusion. I have a simple example from my own research.

One of my favorite lines to research are the Dimicks. They moved from Massachussetts to Connecticut to New Hampshire and then later to Ohio. I find that I try to do too much in my head sometimes. My brain likes to try to convince me that I can remember things…corrrectly. Well, this demonstration just goes to show two things. One, I can’t remember much very well, and two, using a map is invaluable.

Here’s how I “thought” their migration went:

Gif demonstrating my imagination of how the Dimicks migrated.

It is an unusual migration pattern to cross back over a state you’ve already left. It’s not unheard of or impossible, of course, but usually, people migrated in more of a straight line. This realization got me to look at the exact locations of the Dimicks in each location.

When the Dimicks arrived in America in the 1600s, they lived in Barnstable, Massachussetts, which is located out on the hook of Massachussetts. Now this migration makes more sense:

The actual migration path of the Dimicks.

By looking at a map, instead of depending on my memory, the Dimick migration makes a whole lot more sense. This is now one of the first things I do when working on a project. I look at maps and get a good visual perspective on where all of the people involved were located.

There are several types of maps that can be useful for this. We will look at them in more detail next week.